Cargo
The movement of cargo is critical to sustain economic activity and maintain community demands.
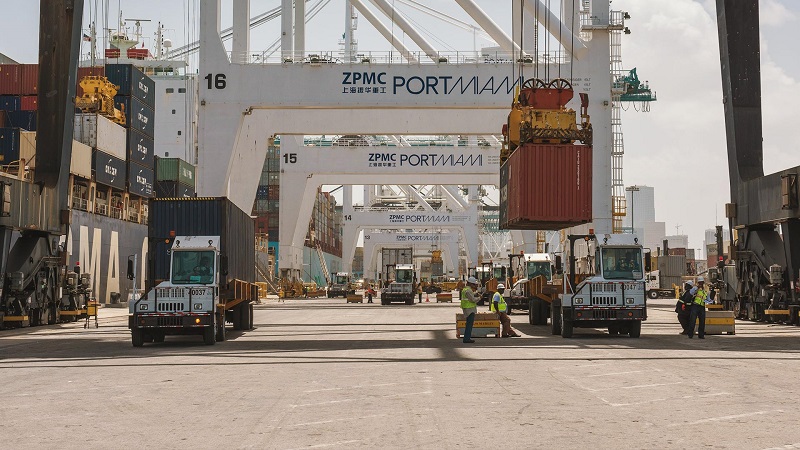
PortMiami keeps cargo flowing by working closely with its industry partners – Port of Miami Tunnel, trucking companies, truckers, terminal operators such as Port of Miami Terminal Operating Company, Seaboard Marine, and South Florida Container Terminal, the International Longshoremen Association, and the warehousing community, among so many others, to keep cargo moving from ship to shelf.
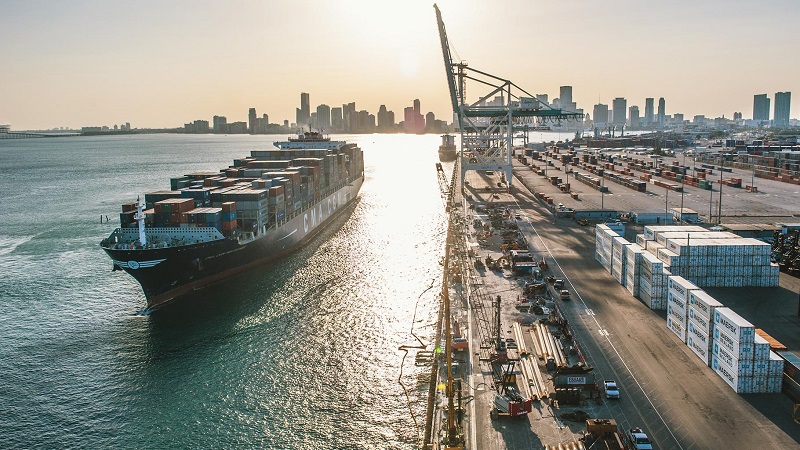
From ship - to port - to terminal - trucking and rail – PortMiami keeps goods flowing to America’s shelves.
2024 Statistics
Visit the Online Berth Request website to submit, modify, track or cancel berthing requests.
The safety of port users and the security of our facilities is a top priority at PortMiami. In collaboration with various federal, state and local agencies, we monitor all areas of the Port.

Watch live webcams of South Florida Container Terminal and POMTOC gates to monitor traffic and avoid congestion.
FTZ 281 at PortMiami helps shippers reduce, defer, or eliminate U.S. Customs duties on imports and exports.

.jpg)
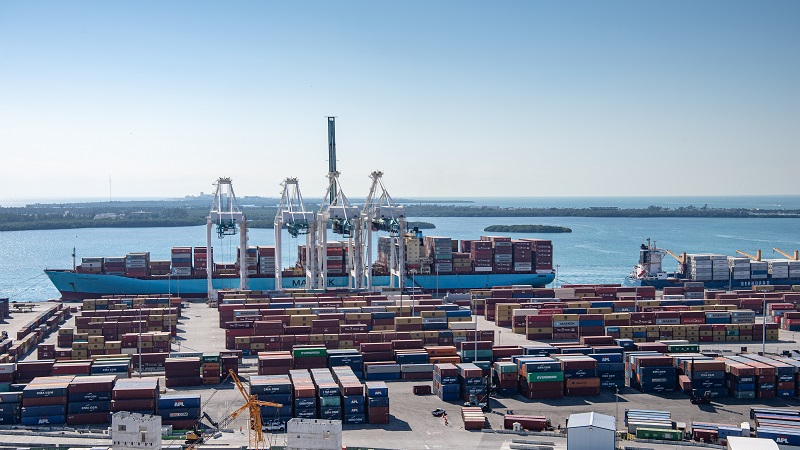
PortMiami, one of the busiest U.S. container ports, handled over 1.1 million TEUs last year and hosts the world's top shipping lines.
PortMiami, in partnership with U.S. Customs and Border Protection (CBP), has created the Transshipment Committee to develop best practices and maintain open communication with port users and stakeholders.
Connectivity
Multimodal interconnectivity provides additional advantages to PortMiami’s customers.

The Port of Miami Tunnel is utilized by more than 23 million vehicles and provides a direct link to the Interstate highway system and takes about 80 percent of port traffic off Downtown Miami streets.
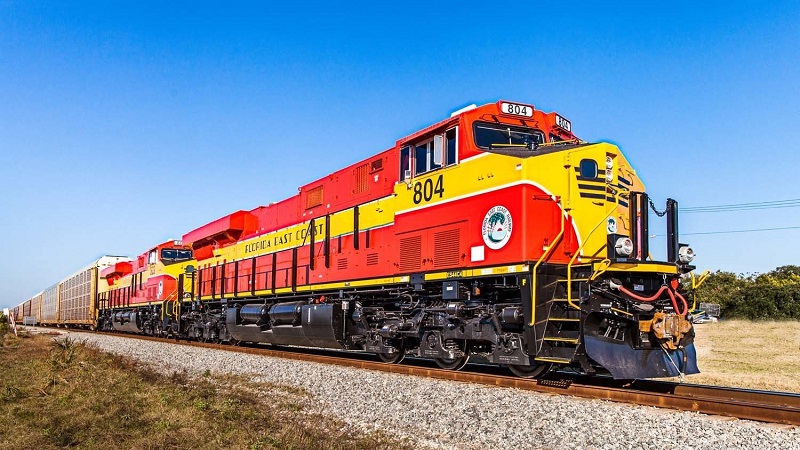
Florida East Coast on-dock intermodal rail delivers goods to 70 percent of the U.S. population within four days.
Connectivity is furthered by our cooperation with and close proximity to Miami International Airport, which ranks No. 1 among U.S. airports in international cargo volume and No. 3 in international passenger traffic.
Historical Snapshot
| Item | 2016 | 2017 | 2018 | 2019 | 2020 | 2021 | 2022 | 2023 | 2024 |
|---|---|---|---|---|---|---|---|---|---|
| TEUs | 1,028,156 | 1,020,192 | 1,083,586 | 1,120,913 | 1,066,738 | 1,254,062 | 1,197,660 | 1,098,322 | 1,089,443 |
| Cargo Ships Docked | 1,231 | 1,422 | 1,081 | 958 | 868 | 939 | 819 | 885 | 945 |
| Inbound Tonnage | 3,871,906 | 4,567,926 | 4,749,255 | 5,745,632 | 5,792,134 | 6,834,613 | 6,978,314 | 5,836,724 | 6,341,429 |
| Outbound Tonnage | 3,827,980 | 4,045,813 | 4,028,719 | 4,375,938 | 3,933,140 | 4,314,614 | 3,237,452 | 3,880,207 | 3,532,085 |
| Total Tonnage | 7,699,886 | 8,613,739 | 8,777,974 | 10,121,570 | 9,725,274 | 11,149,227 | 10,215,766 | 9,716,931 | 10,126,767 |